
 According to a 2022 Allied Market Research report, the size of the global forensic accounting market is forecast to increase in value to $11.68 billion in 2031, up from its 2021 estimated value of $5.13 billion. Allied Market Research puts this compound annual growth rate at nearly 9 percent (8.8 percent). This same report found that the Covid-19 pandemic saw an uptick in the need for forensic accounting skilled professionals and approaches.
Forensic accounting is a specialization within the general accounting profession. Professionals in this specialized subset focus on allegations of financial fraud brought by individuals and businesses in the civil courts and government agencies in the criminal courts. Disputes can range from family members contesting assets and valuations of such assets in an estate, business, or divorce proceedings. When it comes to proving criminal allegations, government agencies look to forensic accountants to investigate financial records for evidence of fraud in the quest to prove crimes such as securities fraud or identity theft.
Forensic Accounting Methodology
According to the Journal of Accountancy and the Association of Certified Fraud Examiners (ACFE), CPAs and specifically forensic accountants can use Benford’s Law to begin the process of identifying potential fraud. Examples of data sets that forensic accountants can build and analyze come from income statements, expense reports, ledgers, balance sheets, invoice and inventory data, accounts payable, and accounts receivable. When analyzing the leading or first digit in a data set, forensic investigators can take the data set and look at how the leading digits are distributed against the percentages that Benford’s Law sets out.
According to the ACFE, in contrast to the common belief that digits occur in equal probability, Benford’s Law states that numbers starting with 1 as the first digit occurs with the highest frequency. Then each subsequent number 2 through 9 occurs with lower probability. According to Carnegie Mellon University, per Benford’s Law, 30.1 percent of a data set will be led by a 1. The digit 2 will be the first in a data set 17.6 percent of the time. For numbers 3 to 9, the likelihood of each respective number leading the data set should become less frequent.
The ACFE gives the example of a counting exercise to illustrate Benford’s Law. When counting to 25, only one of the 25 numbers would lead with a 3; seven numbers would lead with a 2; and there would be 11 leading numbers beginning with 1. Numbers generated by a computer would give equal weighted probability to 1 to 9 being the first or leading digit. If equally weighted numbers were in fact generated, the results would deviate from Benford’s Law. However, simply because Benford’s Law is not observed in the dataset analyzed, it doesn’t automatically mean fraud occurred. But it is a tool that helps forensic accountants investigate further and determine through additional means if fraud did, in fact, occur.
Similarly, the ACFE points out that if someone wants to commit a financial crime, they would generate invoices worth a lot. It would be a lot more effective for someone to pass off invoices of $800 or $900, versus smaller $100 or $200 amounts. While this would make better use of a criminal’s time, according to Benford’s Law, if a forensic accountant were to test a data set against a few hundred invoices, they might see an abnormal percentage of them with high leading numbers, prompting further investigation.
The Journal of Accountancy reminds readers that it’s important to keep in mind a few caveats. The more numbers available in the data set, the better. It can work with as few as 50 to 100 numbers, but more is always preferred. Another consideration, per the ACFE, is where the data comprising the data set originates. Using a sports analogy, if players are between 5 feet and 8 feet tall, it would make testing the data set against Benford’s Law impossible because there’s zero chance of numbers 1 through 4 and 8 or 9 showing up in a probability test. In these scenarios, Benford’s Law wouldn’t apply.
While the method for detecting financial fraud is not black and white, the need for more forensic accountants will not slow down any time soon.
Sources
https://www.acfeinsights.com/acfe-insights/2023/3/28/benfords-law-how-to-use-it-to-spot-fraudnbsp?rq=Benford
https://www.acfeinsights.com/acfe-insights/2023/3/21/benfords-law-applicationsnbsp?rq=Benford
https://www.acfeinsights.com/acfe-insights/what-is-benfords-law?rq=Benford
https://insights.sei.cmu.edu/blog/benfords-law-potential-applications-insider-threat-detection/
https://www.journalofaccountancy.com/issues/2017/apr/excel-and-benfords-law-to-detect-fraud.html
https://www.alliedmarketresearch.com/forensic-accounting-market-A17182




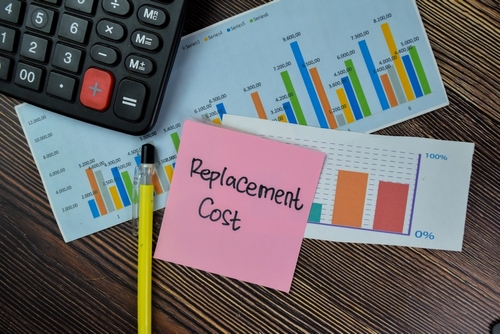 When it comes to businesses looking to mitigate risk, one concept that’s important to explore is reproduction costs. The first step is to distinguish between reproduction and replacement costs. Replacement cost refers to how much it would cost a company to replace an asset that will duplicate the performance of the beginning asset; however, it does not necessarily have to meet the same materials, specifications, etc. Reproduction cost refers to how much it would cost a company to reproduce the asset so that it’s constructed of the same materials, specifications, etc., based on current market prices.
  When it comes to valuing a business, there are many ways to examine a company’s profitability. Looking at a business’ liquidation value and its breakup value are two of many approaches to see how a company is functioning and how it might run under different management and economic environments.
 The Setting Every Community Up for Retirement Enhancement 2.0 Act of 2022, otherwise known as SECURE 2.0, is a piece of legislation that focuses on how employers and their employees are able to save for retirement and how it impacts their bottom lines.